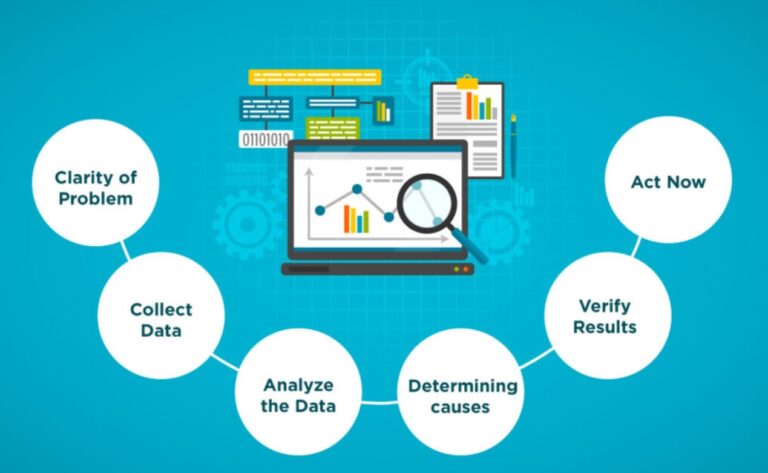
Most organizations today are comfortable with what might be called the surface story of their data. They know what happened, when it happened, and sometimes even where. Yet, decision-making rarely improves from these answers alone. To change outcomes, one must understand why something happened. This move from describing events to diagnosing causes is the true evolution of analytical maturity.
Professionals who undergo data analytics training in Bangalore often find that the shift from descriptive to diagnostic thinking is not about learning new tools as much as learning to look deeper. It is about building a curiosity that sees beyond dashboards and numbers to the underlying patterns, pressures, and relationships that shape results.
The Detective Metaphor: From Reporting to Investigation
Imagine a detective arriving at the scene of a broken window. Descriptive analytics simply reports: The window is shattered. It may add details like at 3:24 AM or in the east wing of the building. But these statements alone do not tell the story.
Diagnostic analytics is the investigation. It asks:
- Was this an accident?
- Was there a break-in attempt?
- Did weather conditions contribute?
- What pattern does this resemble based on past incidents?
The detective does not look at the broken glass alone. They look for fingerprints, footprints, prior records, camera angles, and motive. Similarly, diagnostic analytics requires connecting multiple data sources, recognizing context, and testing hypotheses.
The difference is simple: Descriptive states. Diagnostic explains.
Learning to Recognize the Hidden Patterns
The “why” layer emerges only when analysts learn to see patterns beneath the visible surface. Many businesses stop at metrics because metrics feel concrete. But numbers without narrative can mislead.
For example:
- A sudden drop in sales may look alarming, but the real cause could be a seasonal shift.
- A sudden increase in website traffic may appear to be a positive development, but if conversions are flat, the underlying behavior might tell a different story.
- An increase in employee attrition may point to dissatisfaction, but diagnostic analysis may reveal specific departmental culture or process obstacles as the real cause.
The key is to avoid assuming the first explanation is the correct one. Like a painter studying shades of color, analysts learn to look slowly, connect clues, and build understanding step by step.
Asking Better Questions, Not Just Finding More Data
Diagnostic analytics does not begin with answers. It begins with purposeful questions. In this phase, curiosity is more valuable than dashboards.
Strong diagnostic questions include:
- What changed just before this metric moved?
- Which groups are affected differently by this trend?
- What happens if we trace this signal backwards in time?
- Which internal processes intersect with this outcome?
A person who asks sharper questions uncovers sharper insights. This is why hands-on environments such as data analytics training in Bangalore, emphasize scenario-based work instead of only teaching tool usage. Tools retrieve information. Questions unlock meaning.
Connecting Data with Context
Data alone cannot explain cause. Context creates comprehension. Two businesses may have identical data patterns yet completely different reasons behind them.
Context may include:
- Market conditions
- Product changes
- New leadership decisions
- Customer sentiment shifts
- Seasonal behavior patterns
Without context, diagnostic analytics risks misinterpretation. A business must listen to both numbers and narratives. This blend of quantitative and qualitative reasoning is what turns analytics into strategy.
It is often during team discussions and stakeholder conversations that the story behind data becomes visible. Diagnostic analytics is rarely solitary. It thrives in collaborative problem-solving.
Experimentation as a Path to Understanding
Sometimes the “why” cannot be discovered by analysis alone. It must be tested. Controlled experiments, pilot programs, and A/B tests help confirm or challenge hypotheses.
For example:
- If we believe customer drop-offs are due to website load time, test a faster version.
- If we believe employees leave due to workload imbalance, adjust schedules for one team and observe outcomes.
- If we believe an offline event affected online conversion, isolate time segments and compare behavior.
Experiments turn assumptions into evidence. The confidence they provide leads to more meaningful decision-making.
Conclusion: The Why Layer Is a Mindset, Not a Method
Moving from descriptive to diagnostic analytics is less about tools and more about thinking deeply, asking persistently, and connecting thoughtfully. It is about cultivating patience, curiosity, and collaborative reasoning. Analysts who master the “why” layer become strategic partners to leadership rather than report generators.
Whether someone is starting out or advancing their career through data analytics training in Bangalore, the most valuable skill is the ability to explain what lies behind the numbers. The organizations that thrive are those that do not stop at knowing what happened. They learn to understand why it happened and what they can do next.
The “why” layer transforms data from a mirror into a compass. It directs action, shapes decisions, and builds resilient strategies in a world where surface-level answers are no longer enough.
